Now a general weather chat thread


Jaytee said:
WxNut2.0 said:
Tend to believe the risk for more intense cold — with an attendant risk for snow — will increase as we enter mid-month. Figure the risk starts in around a week.
so, at around every five days or so we’ll have a storm? And depending on how much cold air is in place, we’ll get snow? We are overdue for those weekly snow storms we used to get.
I’m not sure it’s going to be exactly that cyclic, but the likelihood is definitely higher mid-January onward.

Well right after this monster storm, we’re in for more this weekend. Looking at this present storm, it stretches from Colorado to New Jersey and Canada to Florida. Didn’t sandy look kinda similar on radar? Pulling up all that moisture along the coast? Not hyping at all…. Just bantering
Jaytee said:
Well right after this monster storm, we’re in for more this weekend. Looking at this present storm, it stretches from Colorado to New Jersey and Canada to Florida. Didn’t sandy look kinda similar on radar? Pulling up all that moisture along the coast? Not hyping at all…. Just bantering
sandy was quite large but they’re obviously very different types of storms. This is a true mid-latitude cyclone; Sandy was a hurricane that got much larger as it interacted with a mid-latitude trough and became extra tropical.


do you think this storm will live up to they hype? closing schools and business early. i dont remember this ever happening in the past
boookwormnj said:
do you think this storm will live up to they hype? closing schools and business early. i dont remember this ever happening in the past
since the governor declared a state of emergency starting at 5pm, all after school activities were canceled. MPD is advising people to stay off the roads. It’s mostly because of the potential for damaging winds. Is it hype? Who wants to be outside in this weather? I saw a power line come down once years ago on the sidewalk on valley, it literally cut through the concrete. Better to be safe than sorry. If they don’t warn you then it’s another problem!
boookwormnj said:
do you think this storm will live up to they hype? closing schools and business early. i dont remember this ever happening in the past
It’s a lot of rain and wind. The forecast has been consistent and appears to be verifying just fine.

Low-lying areas are already starting to flood.
From Maplewood PD via Nixle:
Pierson Rd will be closed off between Valley St / Burnet St due to flooding. Please use alternate route.
https://www.njweather.org/maps/mapviewer?mapname=watercontentvf_10cm
to view soil water content at some locations in NJ. If there ever was a time when the values would be 1.0, or close to it, I thought it would be now. Especially as the ground seemed fairly saturated prior to yesterday’s rain.
I see values (at 10 cm) such as 0.31 (Middlesex County) and 0.48 around the Morris-Passsic border. The map suggests these values are current, from today, at 2:40P. When I looked this morning shortly after daybreak, the values were very similiar to those now.
This is from an Iowa State Ext. website:
“A value of 0 means soil moisture is at the wilting point (very dry) while a value of 1 means soil moisture is at saturation (very wet). A value of 0.54 means near optimum soil moisture for plant growth while values below 0.2 and above 0.8 indicate drought and excess moisture stress.”
Can someone explain what’s going on?
dickf3 said:
https://www.njweather.org/maps/mapviewer?mapname=watercontentvf_10cm
to view soil water content at some locations in NJ. If there ever was a time when the values would be 1.0, or close to it, I thought it would be now. Especially as the ground seemed fairly saturated prior to yesterday’s rain.
I see values (at 10 cm) such as 0.31 (Middlesex County) and 0.48 around the Morris-Passsic border. The map suggests these values are current, from today, at 2:40P. When I looked this morning shortly after daybreak, the values were very similiar to those now.
This is from an Iowa State Ext. website:
“A value of 0 means soil moisture is at the wilting point (very dry) while a value of 1 means soil moisture is at saturation (very wet). A value of 0.54 means near optimum soil moisture for plant growth while values below 0.2 and above 0.8 indicate drought and excess moisture stress.”
Can someone explain what’s going on?
this seems about right to me. Soil needs persistent rain to saturate, and a lot depends on permeability and rate of evaporation. 10cm is also 4” deep, meaning the water needs to seep fairly far down. I’d be curious what the saturation at say 5cm is.

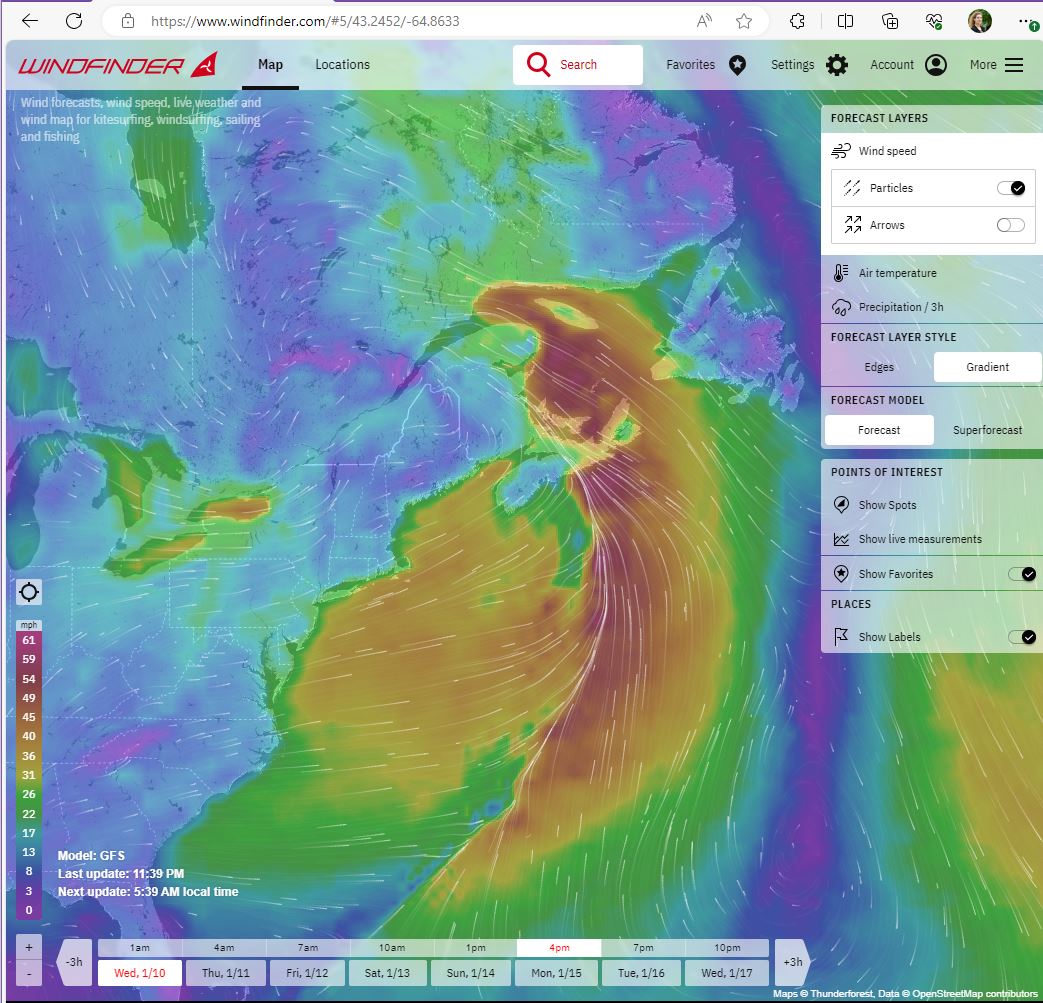
I was looking at wind patterns, which looked really interesting during this storm. The dark orange/red area where the two vectors meet and curl around were along the east coast yesterday, and are now moving out to sea.
I showed it to my 18 yr old son, and he looked at this picture and said "Oh, it's the hairy ball theorum!"
I gave him a sideways look, and he said "No, it's a real thing. You can look it up!"
I said "I'm not googling that".
He said "I'll look it up on my phone... see! It's topology."
And it was images of wind patterns, along with a baby's head with a hair whorl. So... I'm still hesitant to google it myself. But I guess I learned something new.

sprout said:
I was looking at wind patterns, which looked really interesting during this storm. The dark orange/red area where the two vectors meet and curl around were along the east coast yesterday, and are now moving out to sea.
I showed it to my 18 yr old son, and he looked at this picture and said "Oh, it's the hairy ball theorum!"
I gave him a sideways look, and he said "No, it's a real thing. You can look it up!"
I said "I'm not googling that".
He said "I'll look it up on my phone... see! It's topology."
And it was images of wind patterns, along with a baby's head with a hair whorl. So... I'm still hesitant to google it myself. But I guess I learned something new.
It's also a cyclone, with the steeper pressure gradient (and thus the higher winds) on the leading edge
max_weisenfeld said:
sprout said:
I was looking at wind patterns, which looked really interesting during this storm. The dark orange/red area where the two vectors meet and curl around were along the east coast yesterday, and are now moving out to sea.
I showed it to my 18 yr old son, and he looked at this picture and said "Oh, it's the hairy ball theorum!"
I gave him a sideways look, and he said "No, it's a real thing. You can look it up!"
I said "I'm not googling that".
He said "I'll look it up on my phone... see! It's topology."
And it was images of wind patterns, along with a baby's head with a hair whorl. So... I'm still hesitant to google it myself. But I guess I learned something new.
It's also a cyclone, with the steeper pressure gradient (and thus the higher winds) on the leading edge
that’s actually not the leading edge per se, the strongest winds in that image are associated with the cold front. The center of the cyclone is well back into Quebec in that image.
WxNut2.0 said:
dickf3 said:
https://www.njweather.org/maps/mapviewer?mapname=watercontentvf_10cm
to view soil water content at some locations in NJ. If there ever was a time when the values would be 1.0, or close to it, I thought it would be now. Especially as the ground seemed fairly saturated prior to yesterday’s rain.
I see values (at 10 cm) such as 0.31 (Middlesex County) and 0.48 around the Morris-Passsic border. The map suggests these values are current, from today, at 2:40P. When I looked this morning shortly after daybreak, the values were very similiar to those now.
This is from an Iowa State Ext. website:
“A value of 0 means soil moisture is at the wilting point (very dry) while a value of 1 means soil moisture is at saturation (very wet). A value of 0.54 means near optimum soil moisture for plant growth while values below 0.2 and above 0.8 indicate drought and excess moisture stress.”
Can someone explain what’s going on?this seems about right to me. Soil needs persistent rain to saturate, and a lot depends on permeability and rate of evaporation. 10cm is also 4” deep, meaning the water needs to seep fairly far down. I’d be curious what the saturation at say 5cm is.
Here is what was going on:
Being a novice, I mistakenly believed that the element displayed in the NJwesther.org map (link provided above) was the relative soil moisture index (referenced in the Iowa State Extension snippet I provided above).
In fact, the element displayed is the Volumetric Water Content (VWC), which is defined as the ratio of the volume of water in the soil to the full volume of the wet soil (including solid material, water, and air). VWC never approaches 1, as that would imply soil completely comprised of water. The actual VWC when soil is completely saturated depends on the soil characteristics. It ranges from 0.30 in sandy soils to 0.60 in clay soils.
Knowing that the soil was fully saturated at 10 cm (roughly 12 hours after the prolonged soaking January 9 into early January 10), and not having received, here, an explanation as to “what’s going on?”, I wrote to an experienced climatologist. He kindly responded, gently pointing out the error I made.
“element”. I like that word. I borrowed it from him.

Hello, does anyone know if the recycling scheduled for Tuesday changed due to the anticipated weather conditions?
Rentals
-
Huge Brand New construction Apartment in 2 family home with 4 bedrooms 3 bathrooms

4 Bd | 3Full Ba
$4,500
Sponsored Business


Promote your business here - Businesses get highlighted throughout the site and you can add a deal.

so, at around every five days or so we’ll have a storm? And depending on how much cold air is in place, we’ll get snow? We are overdue for those weekly snow storms we used to get.